Demo Smart City 1
Smart City Model
as a virtual copy of the urban area
The online demo presents the model of urban area as a complex cyber-physical system having its generic structure corresponding to the specific city and international standard at the same time. It runs on the city engine in cloud and receives big data streams from various data sources about ongoing processes and transforms the information into rich set of custom information services, analytics and controls. The both internal and cross-organizational services are offered and utilized by participants of the value chain.
The sample generic model of urban area is realized accordingly to the ISO 37120:2014 including its definitions of themes and urban indicators. It can be used as the illustration of the modeling principles and as the template for development of the actual local version of the particular urban area in complaince with other standards such as ITU-T, Smart Sustainable Cities, CEN-CENELEC-ETSI, CityKeys, etc.
To illustrate rich set of options for developing realistic complex Smart City applications the demo Smart City Model was provided with a number of typical sample urban area objects, data sources and optional controls. Each of them reveals information about the status of real cyber-physical object or process taking place in the urban area in real time.
The Smart City Model provides comprehensive vision of city processes ranging from the simple measurements of city pollution, city noise, traffic congestion in diverse locations, status of objects providing services to citizens, etc to complex aggregated urban models revealing ongoing urban transformations. This holistic view can be available to citizens, tourists and city administration in real time and presented on the City Map of Life, Monitor dashboard, interactive reports and personalized events.
Supported by advanced analytics the solution fosters quality of life and sustainable development goals that address economic growth and efficiency, ecological and infrastructural construction, environmental protection, social and welfare progress. The build in benchmarking options facilitate simple and easy comparison and analysis “The Policy => The Impact” between two or more cities.
Overview of Smart City Model running as demo
The model contains the following main groups of objects
1. Complete ISO 37120:2018 model with its urban themes e.g. Energy, Environment, Finance, Water, Waste, etc, relevant core indicators and auxiliary urban indicators introduced for calculation of the core indicators for each theme
2. The other objects presenting local businesses, services, cultural places, etc are mostly factual and has association with typical categories such as Administrative, Cultural, Educational, Medical institutions, Transportation, Sports, Recreation, Stores, Hotels, etc
3. Different types of sensors installed in the urban area providing information about specific measurements (CO2, NOx, Sound level, etc) in different geo-locations. The sensors have categories of belonging to different owners (city, state, private).
The data sources are associated with each specific civic object and used in the calculation of the object indicators. The common data update period is selected 1 day however in some ISO themes such as Energy, Water, Finance, etc it is equal to 1 month and in the Governance is equal to 1 year.
Application category: Medium-sized city
City population: ~ 50,000 citizens
Source data: Corresponds to statistical averages for cities in Europe and USA with population about 50,000.
Optional object states of the City as a whole and for each of its object – themes are formulated as “Excellent” – Green color, “Optimal” – Blue color, “Deficient”- Red color (terminology is customizable, i.e. user defined)
History of object states is calculated in daily periods for each object which has data sources and indicators; in particular it is available for ISO 37120 theme-objects (viewed by click on object status icon). The statuses for particular sample city services and objects on the map are not available as there is no real time data in the demo.
Rules for the automatic object state calculation are custom defined for each object depending on combination of latest calculated values of object indicators, its planned or acceptable targets and sub-objects (if any)
Total number of the sample map objects in all categories: 37
Total number of sample sensors on the city map: 30
Type of optional maps: OpenStreetMap or Mapbox
ISO 37120 theme-objects model
Definition of indicators and 16 sub-object themes: accordingly to ISO 37120 standard “Sustainable development of communities — Indicators for city services and quality of life”
Total number of indicators for all themes-objects: 102
Total number of core indicators for all themes: 46
Total number of auxiliary indicators for all themes: 56
Total number of open data sources: 60
Time interval for data time series related to theme indicators: 12 months
Data update periods: All data has monthly updates, Governance data is updated annually, Environment data includes fine particulate matter PM2.5 and PM10 concentrations and updated daily (as application example).
Data preparation and storage: In demo version the data for ISO 37120 indicators for the sample city are generated randomly accordingly to average middle size city statistics. In real Smart City installations the open data sources could be implemented based on information from sensor networks or imported from particular city databases or files prepared by municipality staff or relevant service providers i.e. Energy, Transport, Waste management, Fire, Environment, Education, Health, etc.
Server location: This Smart City demo application model runs on dedicated host server in Germany. In implementations the Smart City server can run the City model being installed in a city building or in cloud.
Open Data transparency: All current on-line demo viewers receive updates regarding on-going events to their Smart City Monitors on-line and in real time accordingly to change identified in each source data. The server can support large number of citizen sessions, city objects and data sources depending on its hardware configuration.
Time acceleration: Demo provides possibility to vary timing of the source data updates i.e. daily events may be simulated to take place each minute. The feature is available for simulation of city development scenarios, planning and development options based on evidence data improve visibility of change processes.
Additional comments:
- The Light Client for the Smart City Monitor runs in a browser (supported in Chrome, Safari, Firefox, Opera only) for viewing, analyzing and searching the information and maps. It does not allow full access to Smart City model, its change, adding and modification of objects, definition of indicators or data sources, etc which are realized in the Power Clients (model builder).
- The city objects presented on the City Map of Life do not have real life source data. For the purpose of illustration the Smart City Model operation some service indicators were formulated which instead of sensor data use data simulated with randomly generators (e.g. 1 measurement each 1 minute). The typical sample indicators used to present public information calculated based on IoT sensor data are as follows:
“Current free service places” (e.g. in car service location)
“Current number of customers waiting for service” (e.g. by doctor, bankmat, tickets office, etc)
“Current expected waiting time for service”
In the real Smart City implementations the City Map of Life, the Monitor dashboard and Reports would present actual performance about every city object in any necessary detail provided with the source data streams.
The current status of city objects can be presented by color icon and controlled by the Smart City server (1) automatically based on calculated indicators and change in source data streams or (2) manually by the object administration (e.g. owner of the shop, restaurant, hotel, parking place, etc). The object administration can use its Smart City client on personal mobile device or send SMS to the Smart City server or set automatic calculation of the object based on in-house information system or own sensors.
Welcome to review short video presenting and explaining these features.
Disclaimer: All sample object details including its names, descriptions, names of people, images, locations, contacts as well as the simulation of Smart City performance in time are completely factious and have no reference to real cities, people and organizations.
Smart City Demo 2
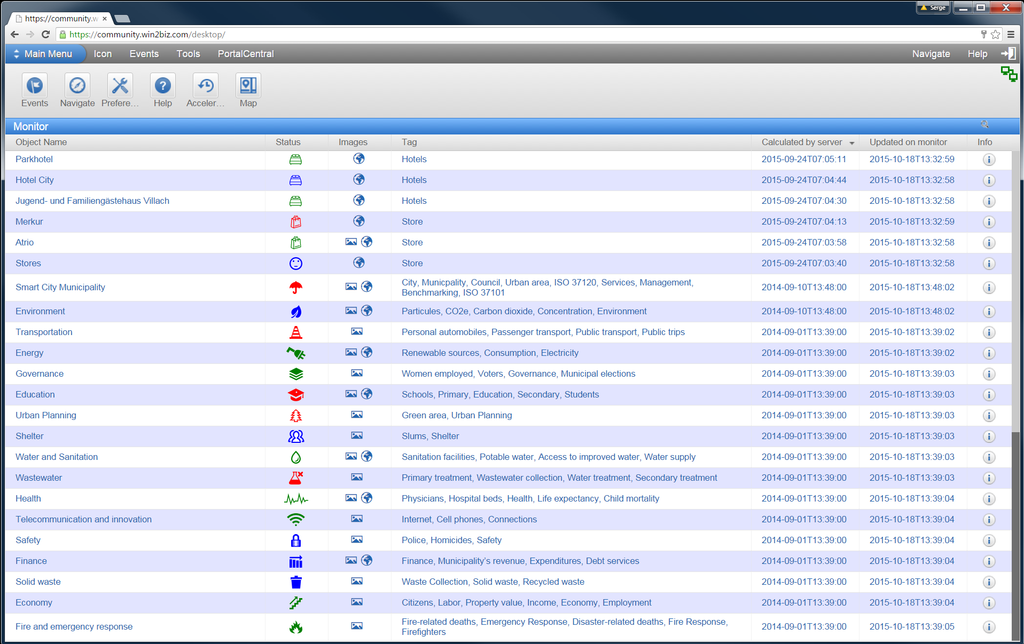
Description of the Monitor dashboard
The list of city objects that is presented at the Monitoring Dashboard, provides user with individual customized view accordingly to user preferences. Several objects of the same type can be combined into one group in toolbar and menu. It simplifies viewing necessary object sets related to business and personal life e.g. Current Quality of Life in our City by ISO 37120, Water Infrastructure or Transportation status in the District, My doctors, My Kids Schools, My Shops, My parking places, Car service stations of company Jet, Our waste collectors in 22 District, etc. When clicked it allows quick analysing the objects, its current statuses, services, performance details, various semantic and visual information in real time.
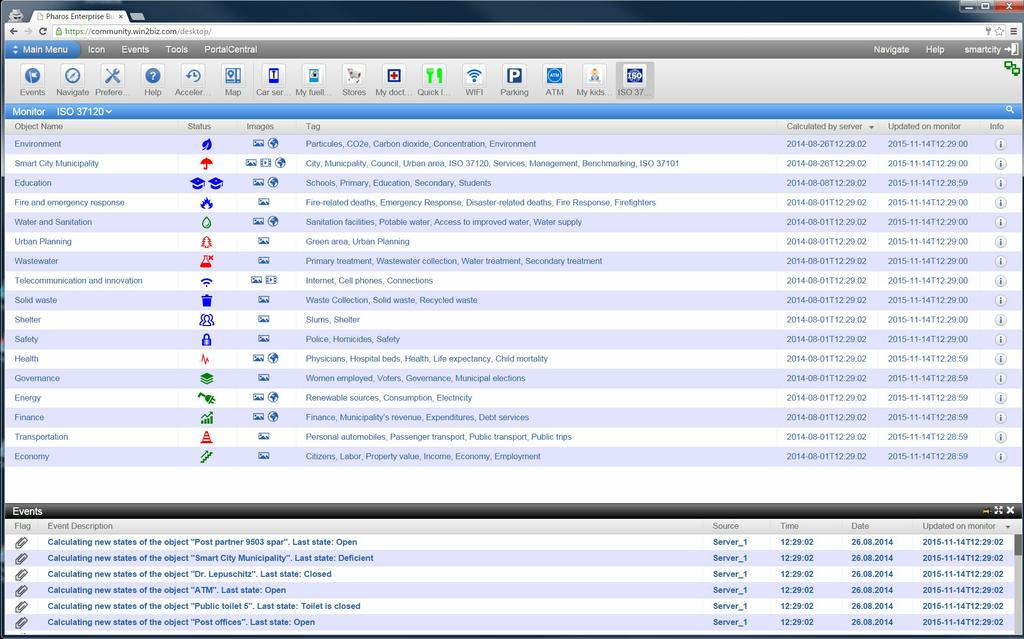
ISO 37120 Model on Monitoring Dashboard
After a click on the Monitor toolbar icon ISO31720, the dashboard presents only the objects that are included into Smart City ISO 37120 Model as theme-objects to simplify the monitoring, benchmarking and analysis of a city accordingly to the Standard.
The object “Smart City” presents holistic vision to the urban area accordingly to ISO 37120 model running on sample open data sets. Its current status during the run may change accordingly to results of each new calculation and is presented by the clickable icon “Umbrella” having different optional colours, icon “Map” and link to online report for further details.
The ongoing status of the city and any other sub-object (Energy, Transportation, Environment, etc) is the result of calculation of combinations of all other sub-objects statuses and indicators in real time and reveals the ongoing sustainability of the object. These may include thousands of various city objects such as energy, waste and water supply, environment, transportation, education, economy, safety, buildings, vehicles, etc.
The default view to these objects is “Table View”. To switch to mobile view click “Mobile”.
Current status of each object is presented as the small colour icon on the right of the object name. The colours are – Green for “Excellent”, Blue for “Optimal”, and Red for “Deficient”.
Any click on the object name link opens its full report with details providing the performance details such as specific KPIs, sub-object statuses, dependencies, cause analysis for each of theme-object are available in the interactive reports.
A click on the object status icon in any place where available, opens the widget with the chart presenting the object status change over time. In-depth analysis of causes of change is available for at any selected moment of time in the past by click on the color box for the particular date. The object indicator values and sub-object states are uploaded to the client and presented to the user for further analysis by clicking on its names everywhere the sign + is present.
A click on the icon in the column Image opens the object map or picture or video (if available).
A click on menu item “Icon or Mobile” allows viewing all objects in Mobile Icon View for easy monitoring of current object states and its changes. Any click on the selected icon leads to opening full report for the corresponding object.
A click on the tag provides selection of only those objects which have the selected tag facilitating quick search of the necessary target objects.
Click on the right icon marked with i in Table View provides brief summary about the object.
Note: Some city objects presented in the demo may not have detailed information, data sources and indicators. It is supposed that such information shall be provided by the owners or administrators of such objects. The complete information is available only for the objects, indicators and data sources related to the definition of ISO 37120 model.
The Events panel below the dashboard reveals the new events that take place in the urban area accordingly to the user preferences. The selection of the desirable event presentation preferences is made by each user individually (in Preferences).
Loading other City object sets
By click on “City services” toolbar you one may find the selection of all relevant objects of the type, see them and their performance on the map. In case the Object is in Red color it means that the service is currently closed or the object is non operational. If available the toolbar icons related to Monitoring can be used for loading preferred sets of civic objects for monitoring, analysis and benchmarking.
Review short video presenting and explaining the main features prior to trying the real life demo.
Demo Smart City 3
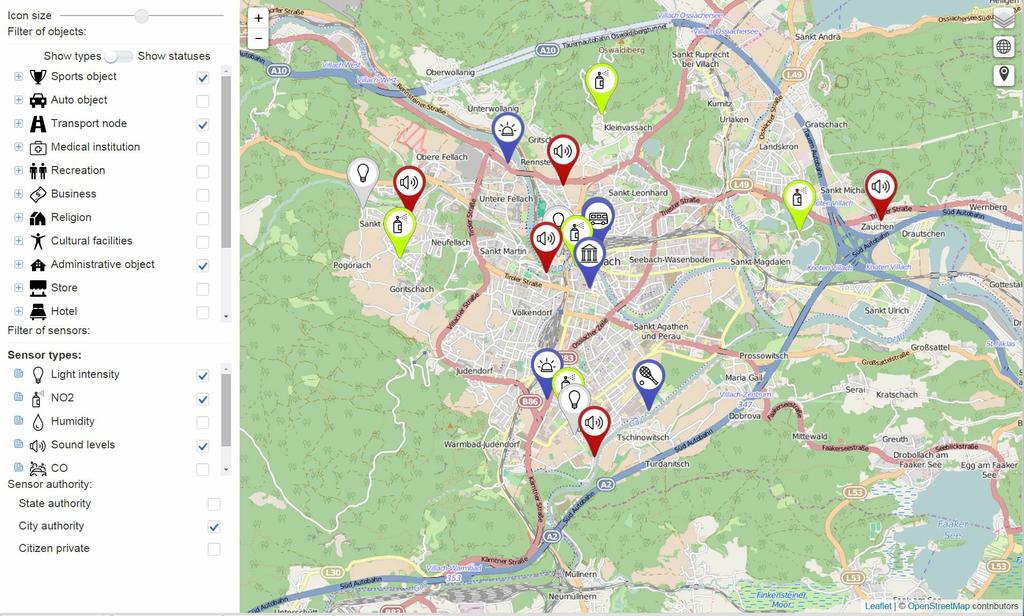
Smart City Map of Life
The urban objects presented on the city map demonstrate rich functionality of the Smart City Monitor in providing diverse real time information about ongoing processes. It can be viewed separately e.g. “My parking places or doctors” or grouped into user defined categories.
The map can be access by click on any icon having map image. The selection, search and analysis and other functionalities become available afterwards.
The ISO theme-objects may (or may not) include concrete Individual city objects related to its categories e.g. objects of Energy, Shelter, Transportation, etc. The grouping depends on decisions of the City Administration, local policies as well as object owners providing relevant data.
For example the Theme Object “Health” can be presented by all registered clinics, medical institutions and hospitals entered as the city objects. If each such object has necessary indicators it can automatically contribute to calculations of the Smart City totals as required by ISO 37120. For example in case the organizations have own performance management systems the results can be imported/sent to Smart City server and used for calculations of city performance.
Otherwise these objects can be presented on the city map as the static ones having only location and description without providing real time performance information (as common feature for mapping city services by various providers such as Google, Yelp, etc).
The Smart City Monitor unique feature is the capacity to collect data from large number of sources, calculate each city object performance individually, aggregate results at each necessary level of governance e.g. by districts and the whole city and present the results accordingly to Smart Governance Model to each citizen.
In the demo model the individual city objects are included into the theme objects e.g. the train station is included into the “Transportation” theme object. However due to lack of data regarding measurements of the train station activities, its performance is not calculated in real time and not included into the indicators of the Transportation theme object.
Any city object can be viewed in its relevant performance report or on the City Map of Life by click on icon Map in Monitor dashboard or toolbar. The selectors on the left side of the Map allow filtering by the object type and status as well as present various types of sensors installed in the city.
Review short video presenting and explaining the main features prior to trying the real life demo.
Demo Smart City 4
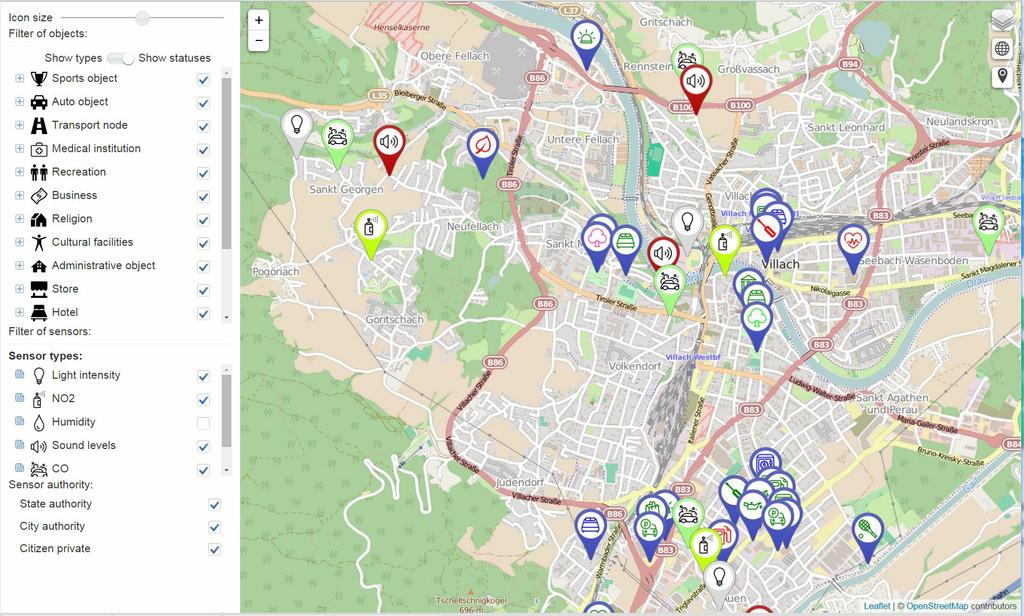
Analyzing the city map and its real life objects
The city objects on its map are available by click on the icon Maps in Smart City Monitor or in any other report or widget where this Map icon is presented .
The complete City Map or its parts required for presentation of relevant information are opened in separate window.
The map can has objects which were defined in the Smart City model or its digital twin depending on the object type selector on the left of the main map. Every object is presented with the relevant icon. The color of the icon reveals current status of the object. A click on the icon reveals its key data such as the object name, icon status, geolocation, main indicator(s) value(s) and link to the object report which may provide detailed information about its performance. The information depends on the object ownership decision regarding providing it’s the performance content to the Smart City Map of Life and availability of the in-house performance management system in the relevant organization.
The pentagon icon near the object selector allows user to define some area on the map and receive information about availability, status and performance of they selected objects in the area.
The Map of Life along with Monitor, Reports and various interactive widgets supports the features described in detail by the following links:
Enriching and enhancing the life of citizens
New opportunities for businesses
Integrated vision of the urban area for the Municipality
The City Map of Life provides citizens, tourists and visitors with rich set of various information services based on such real time information (search, comparisons, events, sharing, problem notification, etc). For example it helps to find operational service within desirable distance from the particular location e.g.: “Where is nearest bankomat (free parking place, open restaurant, pharmacy, etc)?”
The demo presents aggregated, holistic view to the sample selection of target objects in your web browser. In real application such selection is fully customizable and you made necessary settings of your own preference for viewing necessary objects e.g. My doctors, My Kids Schools, My Shops, My parking places, Quality of life in our City by ISO 37120 Model, etc.
In addition: all Smart City Model definitions are customizable by the local Smart City Team e.g. City Map of Life categories can be changed after the installation, the object names and descriptions can be provided in several languages to assist foreign visitors and tourists e.g. in German, English, Chinese and Russian.
The object formulation and placement on the City Map of Life
The urban objects can be defined and placed on the City Map of Life by the city administration (or more precisely it’s Smart City Team). Alternatively objects owners may be authorized by the city administration to manage the information provided to the City Map of Live for their object by themselves (e.g. shops, restaurants, parking places, banks, bankomats, sport facilities, transportation nodes, etc).
Each such object can have any necessary number of performance indicators and own data sources. The current object status (e.g. “Closed/Open” in the simplest case or complex Air Quality Health Indexes, diverse economic benchmarks, etc) as well as its performance can be presented in any necessary detail.
The content and visibility of such performance information for the public use is defined accordingly to policies of the object owners, city administration and national legislation.
Demo Smart City 5
Navigation in Smart City Model content
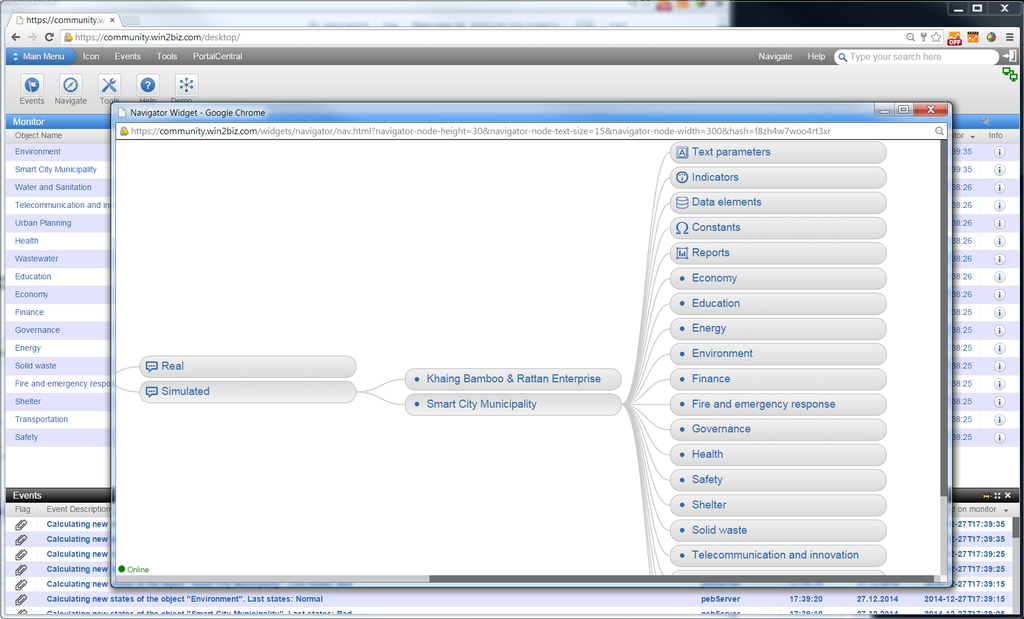
The navigation in Smart City objects, its indicators, data sources, sensors, videocameras, actuators, users and other model components are available by clicking menu button “Navigator” or relevant toolbar icon which opens Navigator in separate window.
Among three main sub-nodes, the node “Objects of monitoring” contain two sub-nodes as follows:
- Real having real life objects which need to be monitored analyzed and managed having data received from various city objects
- Simulated having copies of real life objects as models which can have real data replaced by random generators simulating real life in statistically similar way. The models are used for simulation of various scenarios for development, change, planning and analysis of options.
The demo objects are available under node Simulated as its Smart City data is generated randomly.
The source data node presenting databases and sensors has definitions of data sources required for real life installations.
After click on target object node in Navigator various commands can be accessed by right mouse button click (cursor or finger shall be positioned on selected node). Each command allows access to additional information in relevant widget.
Every node can be clicked on to open its sub-nodes further and review its parameters such as custom texts, indicators, data elements, sensors, constants and sub-objects (if any). The click on the Report node results in opening the same object report as in the relevant name of the object in the Monitor.
The result of clicking on the node depends on node type and client type as follows:
- Object: opening standard object parameters as sub-node branches
- Text: opening customized text parameters
- Indicators: opening report with graph and table for the indicator
- Data element: viewing values
- Constants: viewing values
- Sensors: viewing values
- Report: viewing values
- Sub-object node: opening its own standard properties
The Navigator allows analyzing details of the object model structure,
You may see that the demo server has two application models running simultaneously under the node Simulated such as:
Note: The demo mode is viewed in the browser application called Light Client which does not allow changing of the model content
View short video presenting and explaining the main features prior to trying the real life demo.
Demo Smart City 6
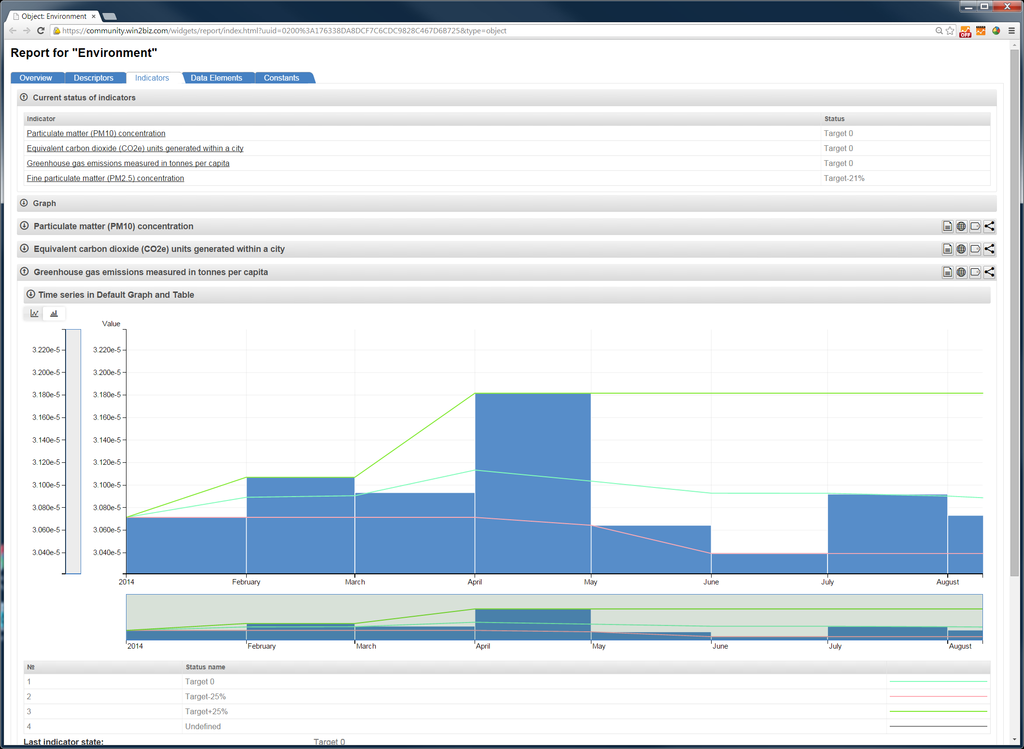
Analyzing the City objects reports in real time
The interactive generic object report provides complete information about the selected object or process in the city infrastructure. In order to have the report the relevant object shall be present in the digital twin of the actual city (or its full cyber-physical model) and the viewer shall have relevant data access authorisation.
The report is opened in additional browser window after any click on the relevant object name in the as link in the Monitoring Dashboard column “Object Name”.
The information in the generic report is structured by the following tabs: Overview, Descriptors, Indicators, Data Elements, Constants, Sensors and Video cameras. Each tab allows focusing on the information related to its category and is updated in real time if the report is opened in your browser.
The administrators of each Smart City Monitor installation can change and customize their city digital twin properties for any urban object being immediately presented in relevant report (i.e. Object names, its pictures and videos, Optional statuses, (static) Descriptors, Summaries, Indicators and its formulas, Data elements and its source databases, linkages to various sensors and IoT and video cameras, constants, pictures, etc).
The online demo includes the urban digital twin model made in full compliance with ISO 37120 and has relevant objects presented in the ISO 37120 Monitoring Dashboard when selected in the toolbar.
The user can customise the toolbar icons to present any necessary views to the city objects and processes that are required for monitoring and analytics by specific user group (e.g. holistic vision of the city performance results by mayor or voice mayors, concrete municipality departments – education, water, air, maintenance status of specific park or building, key traffic accidents, etc).
Tab “Overview” provides generic information about current status of the object and its sub objects if any. There are some widget icons in the upper left corner providing Summary for the object, Tags, Dependencies between objects, data elements, indicators and sub-objects and widget “Analysis of object state change”.
Tab “Descriptors” present custom text description of the (static) object properties.
The tabs “Indicators” and “Data Elements” and “Sensors" and “Video Cameras” present dynamic information as time series in charts and tables about the object for its analysis. The “Video cameras” can provide both video streams and quantifiable information as IoT.
Each indicator and data element and sensor and video camera have own icons providing additional details for analysis in summaries, dependency graphs and selected charts/tables of values and its optional location on the map in 2D.
The interactive object report provides complete information about the object selected by the user including all its static and dynamic properties. It is opened in additional browser window.
Additional information:
-
View short video presenting and explaining the main features prior to trying the real life demo.
-
How to make the urban model accordingly to ISO 37120 standard? View brief video introduction
-
How to make customised indicators? View brief video introduction
-
How to make link sensors and IoT to the model indicators? View brief video introduction
-
How to analyse dependencies between indicators and data sources? View brief video introduction
-
Run your Smart City Monitor online
2026 © GOLEM IMS GMBH, Austria. ALL Rights Reserved.
Terms of Service |
Privacy Policy
Made in Austria