Smart Enterprise demo for manufacturing
Smart Enterprise Monitor allows management and operators focusing on the most important key objects and processes which influence business results while being aware that all other business processes are realized accordingly to plans. It provides immediate notification and access to any necessary detail that helps identifying the cause of a problem.
Any such object can be defined locally, easy and quickly in the enterprise model using Power Client model builder tools. It may be the Enterprise as a whole, each of its Departments, Production, Services, Sales, Customers, Suppliers, Employees, Production or Service Teams, Finances, Machinery, Metrological equipment, Measurements and Quality control, Transportation, etc,
Each business object may have own combination of custom KPI and its optional sub-objects in the hierarchal structure presenting its parts, for example, some customer or product group having similar types of customers (or products) with own data sources.
The initial enterprise definitions require consideration of existing business and service processes however once fixed in the enterprise model and running on enterprise engine one can be sure that it would take care about watching and checking all your business processes routinely in every necessary detail and in real time. The updates regarding every change in processes against desirable or planned outcomes are immediately sent to mobile devices to management and other responsible persons. The access to such information is provided in the secure protected mode and only to those users who is authorized by the management.
As result your enterprise engine makes managerial life easier and freeing up the time for other jobs while realizing highly complex routine tasks of sustainability monitoring. It collects the data from various diverse sources including sensors and cameras all over the enterprise, analyses thousands of business objects at your enterprise, calculates many KPIs in each of them, evaluating on-going states for all focus objects and accordingly to the local definitions of what is “Good”, “Normal” or “Bad” and keeps all involved and authorised updated about ongoing business results.
PharosN application “Smart Enterprise Monitor” demonstrates some of these features based on the model of real factory. Its video presenting main features can be viewed here. The model is available for subscribers as open template for quick implementation of local business content and can be customized to any other business area including services, reselling, etc.
Sample model overview
Category: Small and medium enterprise (SME)
Type: Furniture Production Factory, private ownership
Size: 75 employees
Source data set: Case study (UNIDO project)
Industrial sector by ISIC: 3100 Manufacture of furniture
Total number of application objects running and being monitored: 30
Optional states of the Enterprise as a whole and its sub-objects depending on states of its objects and indicators are “Excellent” – Green color, “Optimal” – Blue color, “Deficient”- Red color
Total number of calculated indicators: 295
Total number of data elements in demo enterprise application: 167
Products
- Number of Product sub-groups (sub-objects) in product group: 2 - Chairs and Sofas
- Number of Products total: 20
- Number of products in Chairs group: 8
- Number of products in Sofas group: 12
- Number of indicators for each product: 10
- Number of data sources for each product: 6
Customers
- Number of customers in Customer group: 5
- Number of indicators for each customer: 6
- Number of data sources for each customer: 3
Data storage: In demo implementation the data is imported from MS Excel files and stored on Pharos database. In other customer enterprise installations the data files can be prepared by enterprise staff and imported directly from their enterprise PCs and application servers or relevant databases in different enterprise departments and branches. In addition the enterprise model can be linked to various sensors, IIoT and digital interfaces in manufacturing machines.
Data updating: daily, after the end of working day. The timing is defined by local management accordingly to internal enterprise operations in each installation.
Business process simulation: demo can use random data generation for each data element to emulate the related processes. In customer installations the actual data is received from IIoT, conveyers, or automated systems or imported from various data sources.
Acceleration of simulation in demo: optional, allowing results for each 1 passed day be calculated in accelerated pace by each 2 minutes
The demo runs on PharosN engine installed in EU and all its viewers receive updates to their Light Clients in real time.
The PharosN Light Client provides viewing functions only and shall run in the browser (latest versions of Chrome, Safari, Opera, Firefox, and IE Edge.
The demo model is the scaled down version of the enterprise model. It is provided to subscribers as open template for local installation and further developments. The customization allows adding or modifying any enterprise object such as products, customers, add technologies, work cells, other departments, etc. The open Enterprise model can be modified locally by enterprise specialists or local automation service partners any time to accommodate changes in businesses processes, enterprise structure, equipment, standards, services, and customer relations.
Step 1: Status of each object at a glance
The Monitor dashboard present custom view for the whole Enterprise and all its sub-objects that are of special interest for some manager as user. The selection of these objects is made by each user individually in menu item Preferences.
The default view to these objects of interest is “Table View”.
The current status of each object is presented as the small color icon on the right of the object name. The colors are “Excellent” – Green, “Optimal” – Blue, “Deficient”- Red
A click on an object name link opens its full report with details.
A click on the object status icon in any place where available, opens the widget with the chart and analytics presenting the object status change over time. In-depth analysis of causes of change is available for at any selected moment of time in the past by click on the color box for the particular date. The object indicator values and sub-object states are uploaded to the client and presented to the user for further analysis by clicking on its names everywhere the sign + is present.
A click on the icon in the column Image opens the object map or picture or video (if available) or enterprise map which can be drilled down to the plan each building.
A click on menu item “Mobile” allows viewing all objects by its animated icons for easy monitoring of current object states and its changes. Any click on the selected icon leads to opening the report for the corresponding object.
A click on the tag provides selection of only those objects which have the selected tag facilitating quick search of the necessary target objects.
Click on the right icon marked with i in Table View provides brief summary about the object.
The Events panel below the dashboard reveals the events which took place. On click the event details provides its further details.
Overview of the features in short video
How to make customised indicators? View brief video introduction
How to analyse dependencies between indicators and data sources? View brief video introduction
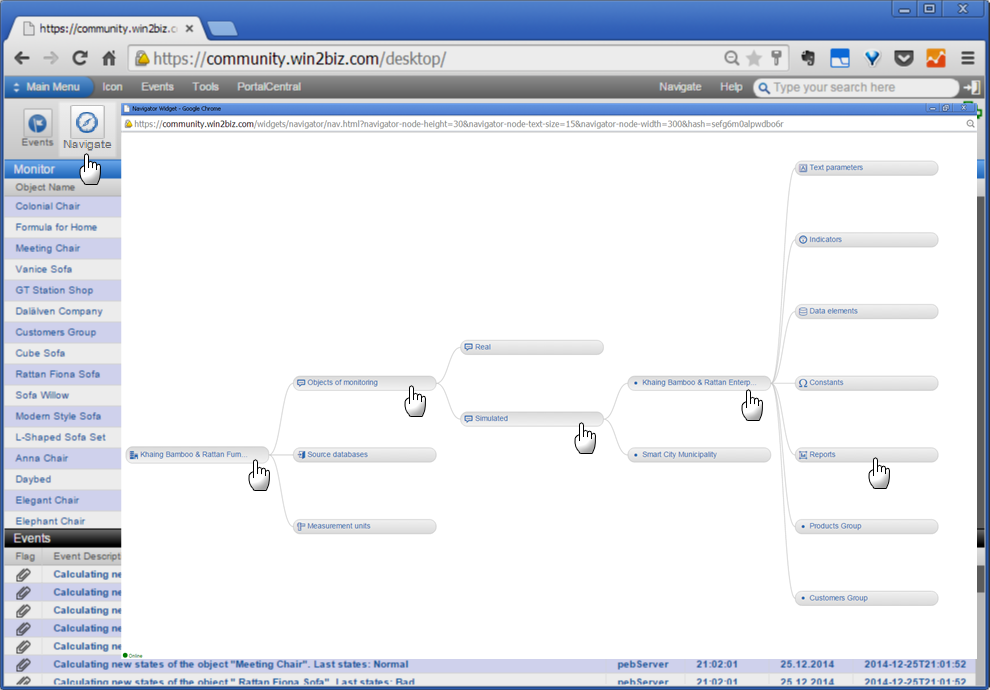
Step 2: Navigating
The navigation in the Enterprise model objects, its data sources, users and other components is available by clicking Navigator menu button at Monitoring Dashboard that opens separate Navigator window.
Among three main sub-nodes the node “Objects of monitoring” contain two sub-nodes:
- “Real” having real life model of enterprise objects that need to be monitored, analyzed and managed but not changed
- “Simulated” having the copy of real life enterpse model or other objects' models that can be modified for simulation of changes in products, technologies, etc and used for analysis of options, scenario building, decision preparation, etc.
Demo objects are available under node Simulated. In real life installations the model runs under the node “Real” enabling linking to any other data sources such as databases, software and automated control systems, sensors and Internet of Things.
After target demo object node is available in the Navigator various commands can be accessed by right mouse button click when cursor (or finger) is positioned on selected node. Each command allows access to additional information in relevant widget.
Every node if clicked opens its sub-nodes and provides review of its parameters such as custom texts, indicators, data elements, constants, sensors and sub-objects (if any). A click on the Report node opens the same object report as in Pharos Monitor. The result of clicking on the node in the Navigator graph depends on node type as follows:
- Object: opening standard object parameters as sub-node branches
- Text: opening customized text parameters
- Indicators: opening report with graph and table for the indicator
- Data element: entering additional value manually
- Constants: entering additional value manually
- Report: entering additional value manually
- Sub-object node: opening its own standard properties
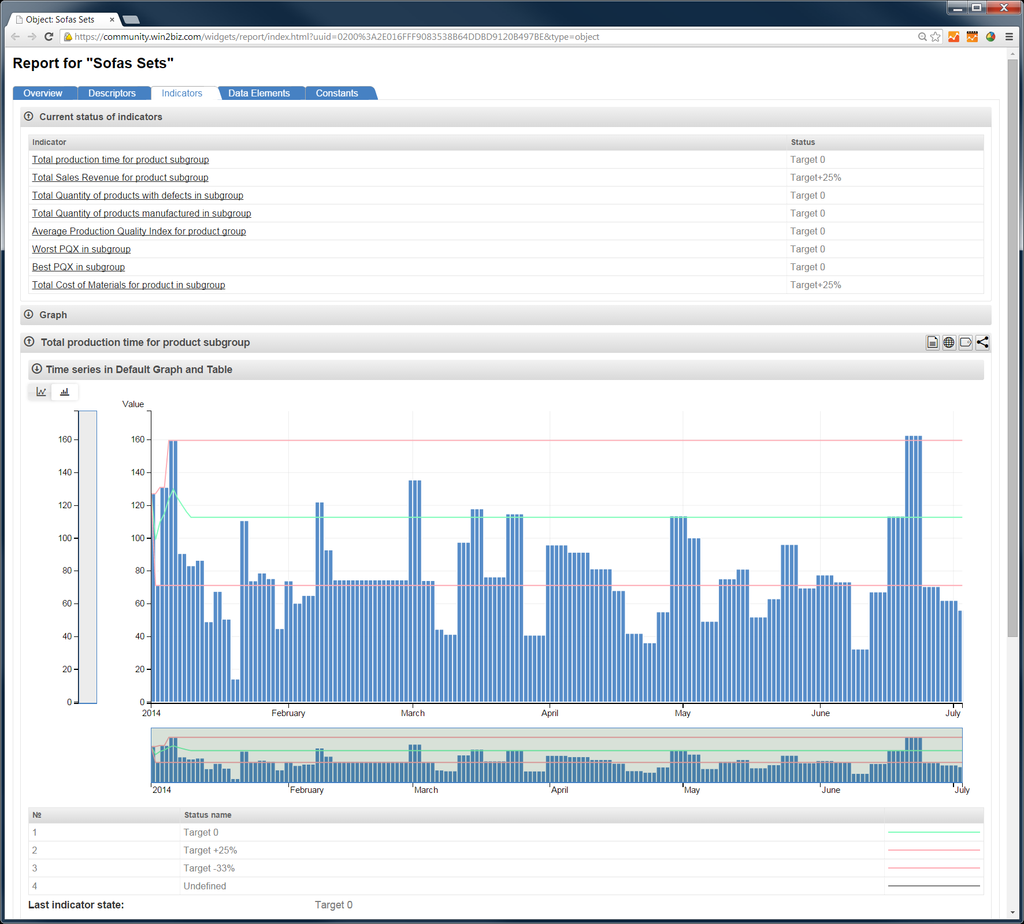
Steps 3: Interactive reports and widgets
The information is structured by 6 tabs: Overview, Descriptors, Indicators, Data Elements, Constants and Sensors and Video cameras. Each tab allows information related to its category.
Overview of the features in short video
Tab Overview has information about current state of the object and its sub objects if any. It has multiple visions of the enterprise in pictures, video, maps, plans, diagrams, dependencies, etc. There are widget icons in the upper left corner (under the name of the tab Overview) providing additional information such as Summary for the object, Tags, History of object state change, Maps/Plans and Dependencies.
Tab Descriptors presents custom description of object properties related to the particular object.
Tabs Indicators and Data Elements present charts and tables of time series for the analysis. Each indicator and data element has own icons providing additional information details in summaries, dependency graphs and selected charts/tables of values.
The information is updated in near real time if the report is opened in your browser.
In their system installations the users can change and customize any of application properties by themselves i.e. Names, Descriptors. Summaries, Indicators and its formulas, Data elements and source databases, Constants, Pictures, Sensors, etc.
You are welcome to play with Smart Enterprise demo model online.
Note that the enterprise model installation is automatic and made accordingly to the subscription for the engine. It can be used as open template to adapt it your own enterprise model by for quick modification of settings and be connected to relevant enterprise data sources and run in real time.
Run Smart Enterprise Monitor demo online
2026 © GOLEM IMS GMBH, Austria. ALL Rights Reserved.
Terms of Service |
Privacy Policy
Made in Austria